
Example Plan
A read-only example of a cashflow plan
This is a fixed illustration of how Planiva can show short-term monthly pressure, balance resilience and timing trade-offs. It is synthetic, non-editable and not personal advice.
Decision
Work 3 days
Instead of full-time for the next two years
Planning window
24 months
Focused on the next few years, not lifetime retirement
What to watch
Tighter months
Cash drag appears before income adjusts
Purpose
Read-only example
Synthetic scenario, not personal advice
Example scenario
Reduce work for the next two years
Imagine a household considering a move from full-time work to three days a week and wanting to understand whether the next two years still look manageable month by month. The purpose of the example is to show the kind of output Planiva can produce, not to recommend a decision.
What this shows
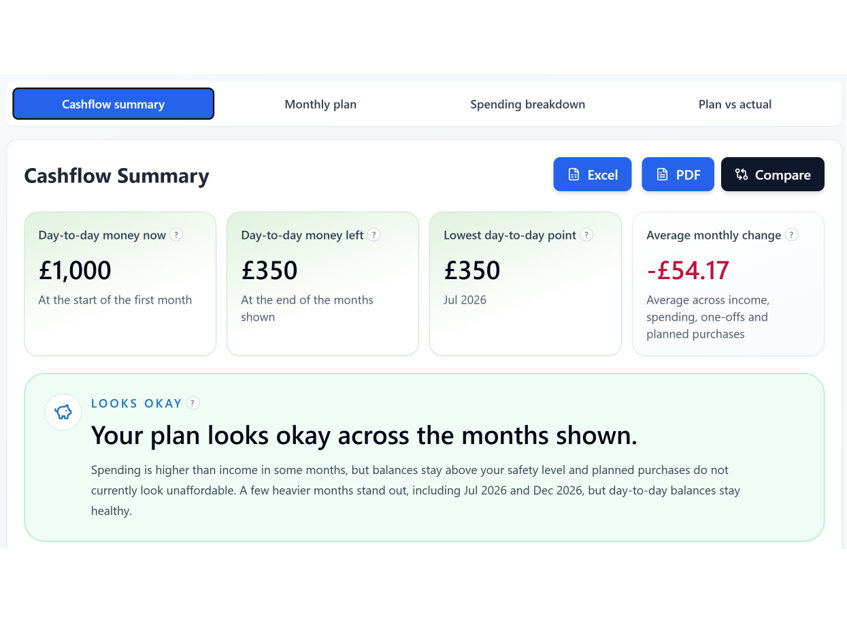
See the overall cashflow summary
This example starts with a near-term question: if work reduces, does the monthly position still hold together without creating unnecessary strain?
- The summary view helps you judge whether the broad direction is workable before digging into month-by-month detail.
- It gives a faster answer to "is this roughly viable?" than a full retirement model.
- It is useful when timing and short-term resilience matter more than lifetime projections.
What this shows
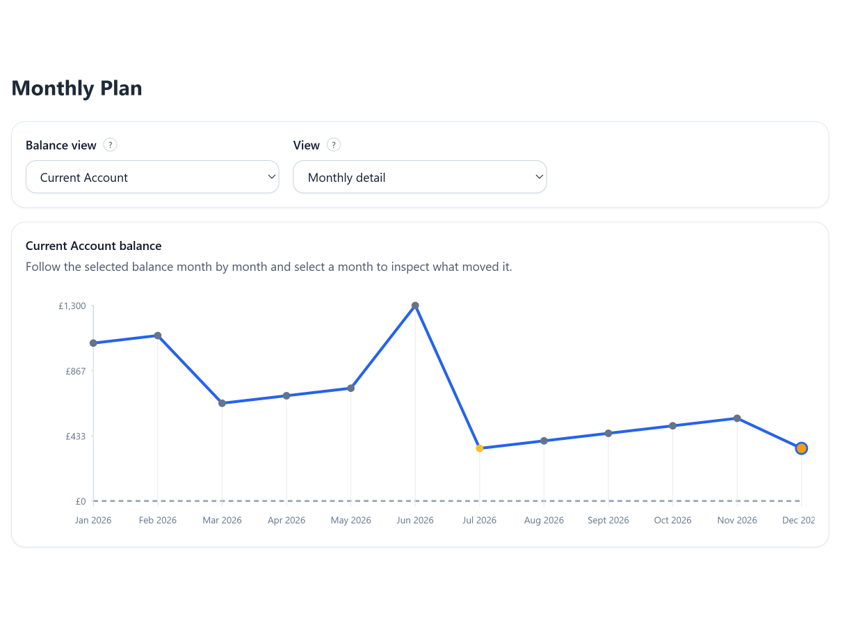
Review the monthly plan output
The monthly view helps you see when balances dip, which months are uncomfortable and whether the plan is only tight for a short stretch or structurally weak.
- This is where awkward months become visible instead of staying hidden inside an annual average.
- It helps you test whether small changes in work, spending or timing remove the pressure.
- It gives you a cleaner basis for comparing one version with another.
What this shows
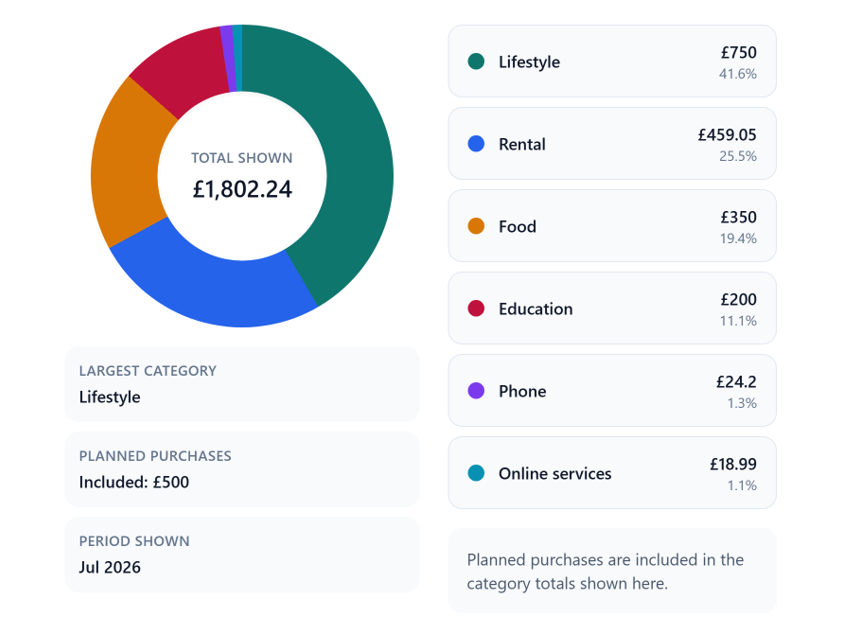
Break spending into the categories driving the outcome
A pressured month is easier to act on when you can see what is actually creating it. The spend breakdown shows where money is going and which categories are doing most of the work.
- This helps separate fixed costs from the spending areas that may be easier to adjust.
- It gives you a clearer basis for deciding whether the plan needs a timing change, a work change or a spending change.
- It turns a general feeling of pressure into something more concrete and comparable.
What this shows
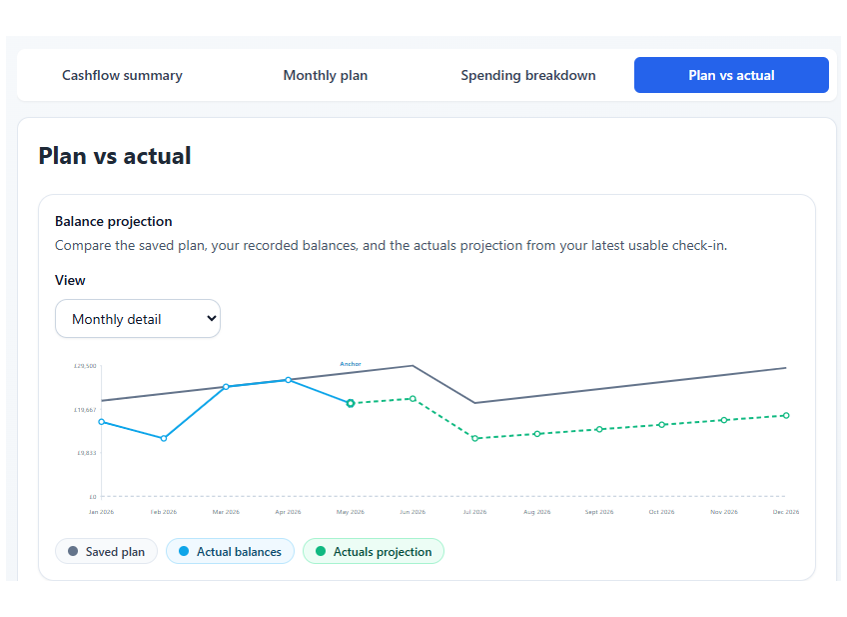
Compare the original plan with actual balances over time
Actuals matter because life rarely follows the first version exactly. This view compares the saved plan, current balances and projected actuals so drift becomes visible early.
- You can see whether the real-world path is staying close to the plan or starting to pull away.
- It helps you decide whether the current version still works or needs another pass.
- It is especially useful when income, spending or one-off costs have changed since the plan was first built.
What you would compare
Compare one near-term path with another
In the real planner, the useful move is to keep a baseline and test a different path beside it. For a cashflow decision, that usually means changing timing, work pattern or spending and seeing how the monthly balance line responds.
Work less sooner
Lower income arrives immediately, so the main question is whether savings and monthly balances can absorb the change cleanly.
Delay the change
Keeping current income for longer may remove the tightest months and create more room before the transition.
What matters most
The value is seeing which months create pressure and whether the trade-off is acceptable before you make the move.
What this example proves
You can model a short-term life choice without turning it into a full retirement project first.
You can see monthly pressure points instead of relying only on annual totals.
You can compare one version against another before committing to reduced work or a temporary gap.
You can identify where timing changes the outcome most.
Next step
Build the version that matches your next few years
The example is fixed on purpose. The real value comes when you replace it with your own income pattern, spending and timing assumptions and then compare another version before you decide.