
Example Plan
A read-only example of a retirement plan
This is a fixed illustration of how Planiva can show retirement timing, future spending and trade-offs. It is synthetic, non-editable and not personal advice.
Decision
Retire at 60
Compared with working until 67
Bridge period
7 years
Before State Pension starts
What to watch
Early tight years
Spending flexibility matters most here
Purpose
Read-only example
Synthetic scenario, not personal advice
Example scenario
Retire at 60 rather than 67
Imagine a household that wants to stop work at 60, bridge the years before State Pension, and understand whether spending later on still looks resilient. The purpose of the example is to show the kind of output Planiva can produce, not to recommend a decision.
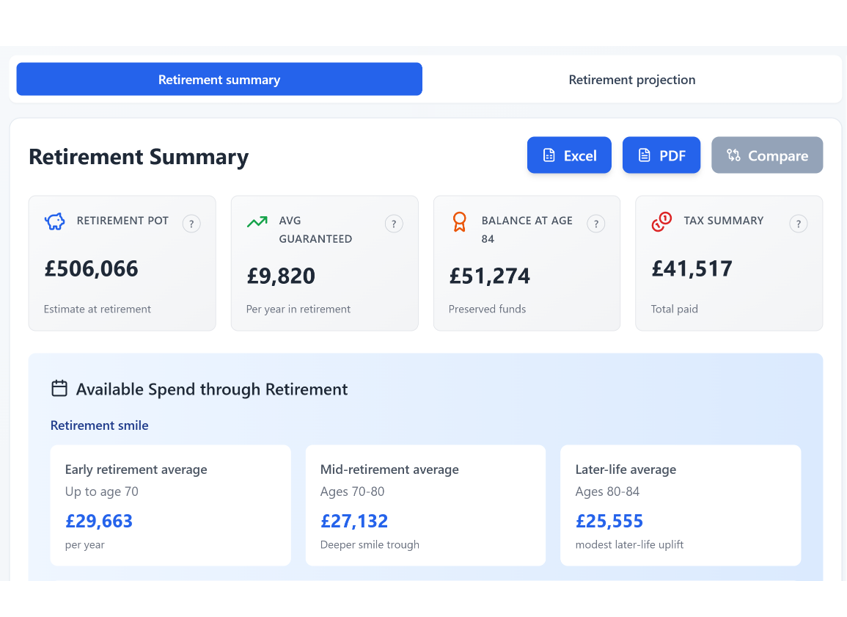
What this shows
See the retirement summary first
This example starts with a summary view so you can see the main retirement picture quickly before digging into the supporting charts.
- A summary view makes it easier to understand the overall direction before looking at detailed chart outputs.
- It helps bring timing, resilience and the main watchpoints together in one place.
- It gives you a faster read on whether the scenario is broadly worth exploring further.
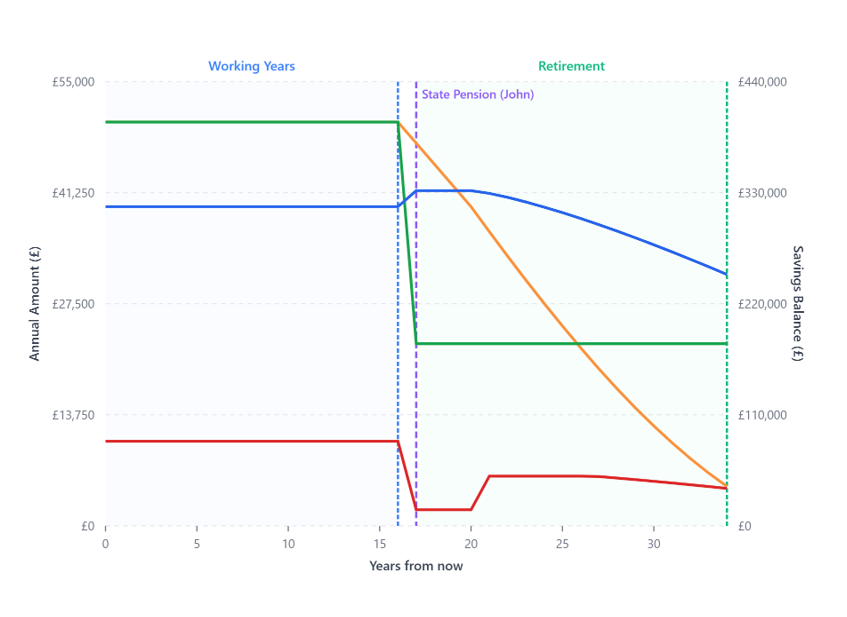
What this shows
Follow the retirement projection underneath
The summary is useful because it compresses the picture, but the underlying projection still matters. This is where you see how income, spending and savings interact over time.
- Working income stops at retirement and pension income takes over.
- The projection shows how spending can stay viable while savings gradually reduce.
- It helps you judge whether the broad shape still works before refining the assumptions.
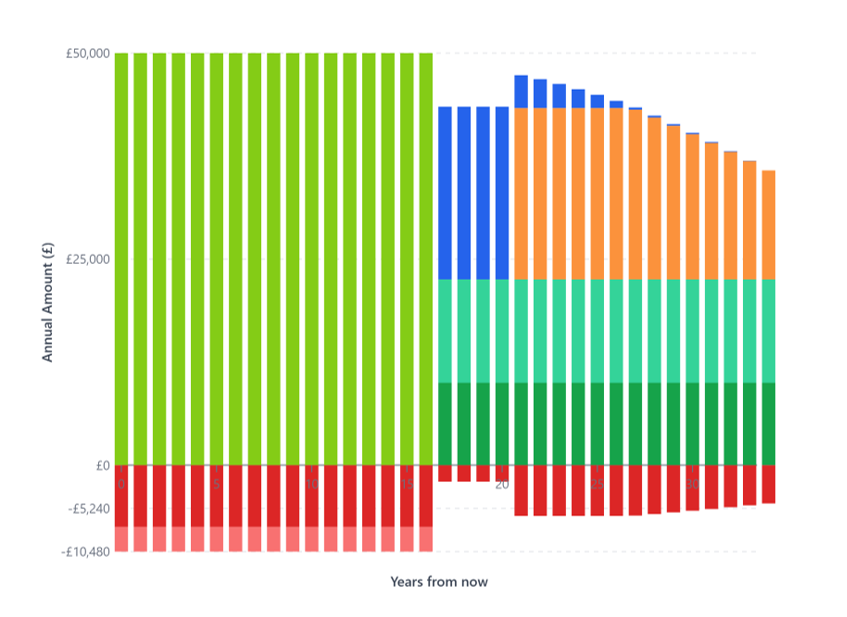
What this shows
Check what spending might be available later
A useful plan is not just about whether money lasts. It is also about what level of spending may be realistic across different phases of retirement.
- This view highlights how available spend can shift over time rather than staying flat forever.
- It helps show whether the earlier years are comfortable or tighter than expected.
- It gives you a better basis for comparing "retire sooner" against "wait longer".
What you would compare
Compare one retirement path with another
In the real planner, the important move is to save a baseline and test another version beside it. For a retirement decision, that usually means comparing timing, spending and how much pressure appears before later income sources arrive.
Retire at 60
More freedom sooner, but a longer bridge before State Pension and less room for higher spending in the early years.
Retire at 67
Later retirement, but a shorter draw on savings and more resilience if spending or market conditions move against you.
What matters most
The useful question is not just whether retirement is possible, but how timing changes flexibility and future headroom.
What this example proves
You can begin with rough assumptions rather than waiting for perfect certainty.
You can test timing decisions before acting on them.
You can compare one version against another without overwriting the first idea.
You can see where the plan becomes tighter instead of relying on one headline number.
Related example
Next step
Build the version that matches your life
The example is fixed on purpose. The value comes when you replace it with your own timing, spending and assumptions and then compare another version before you decide.